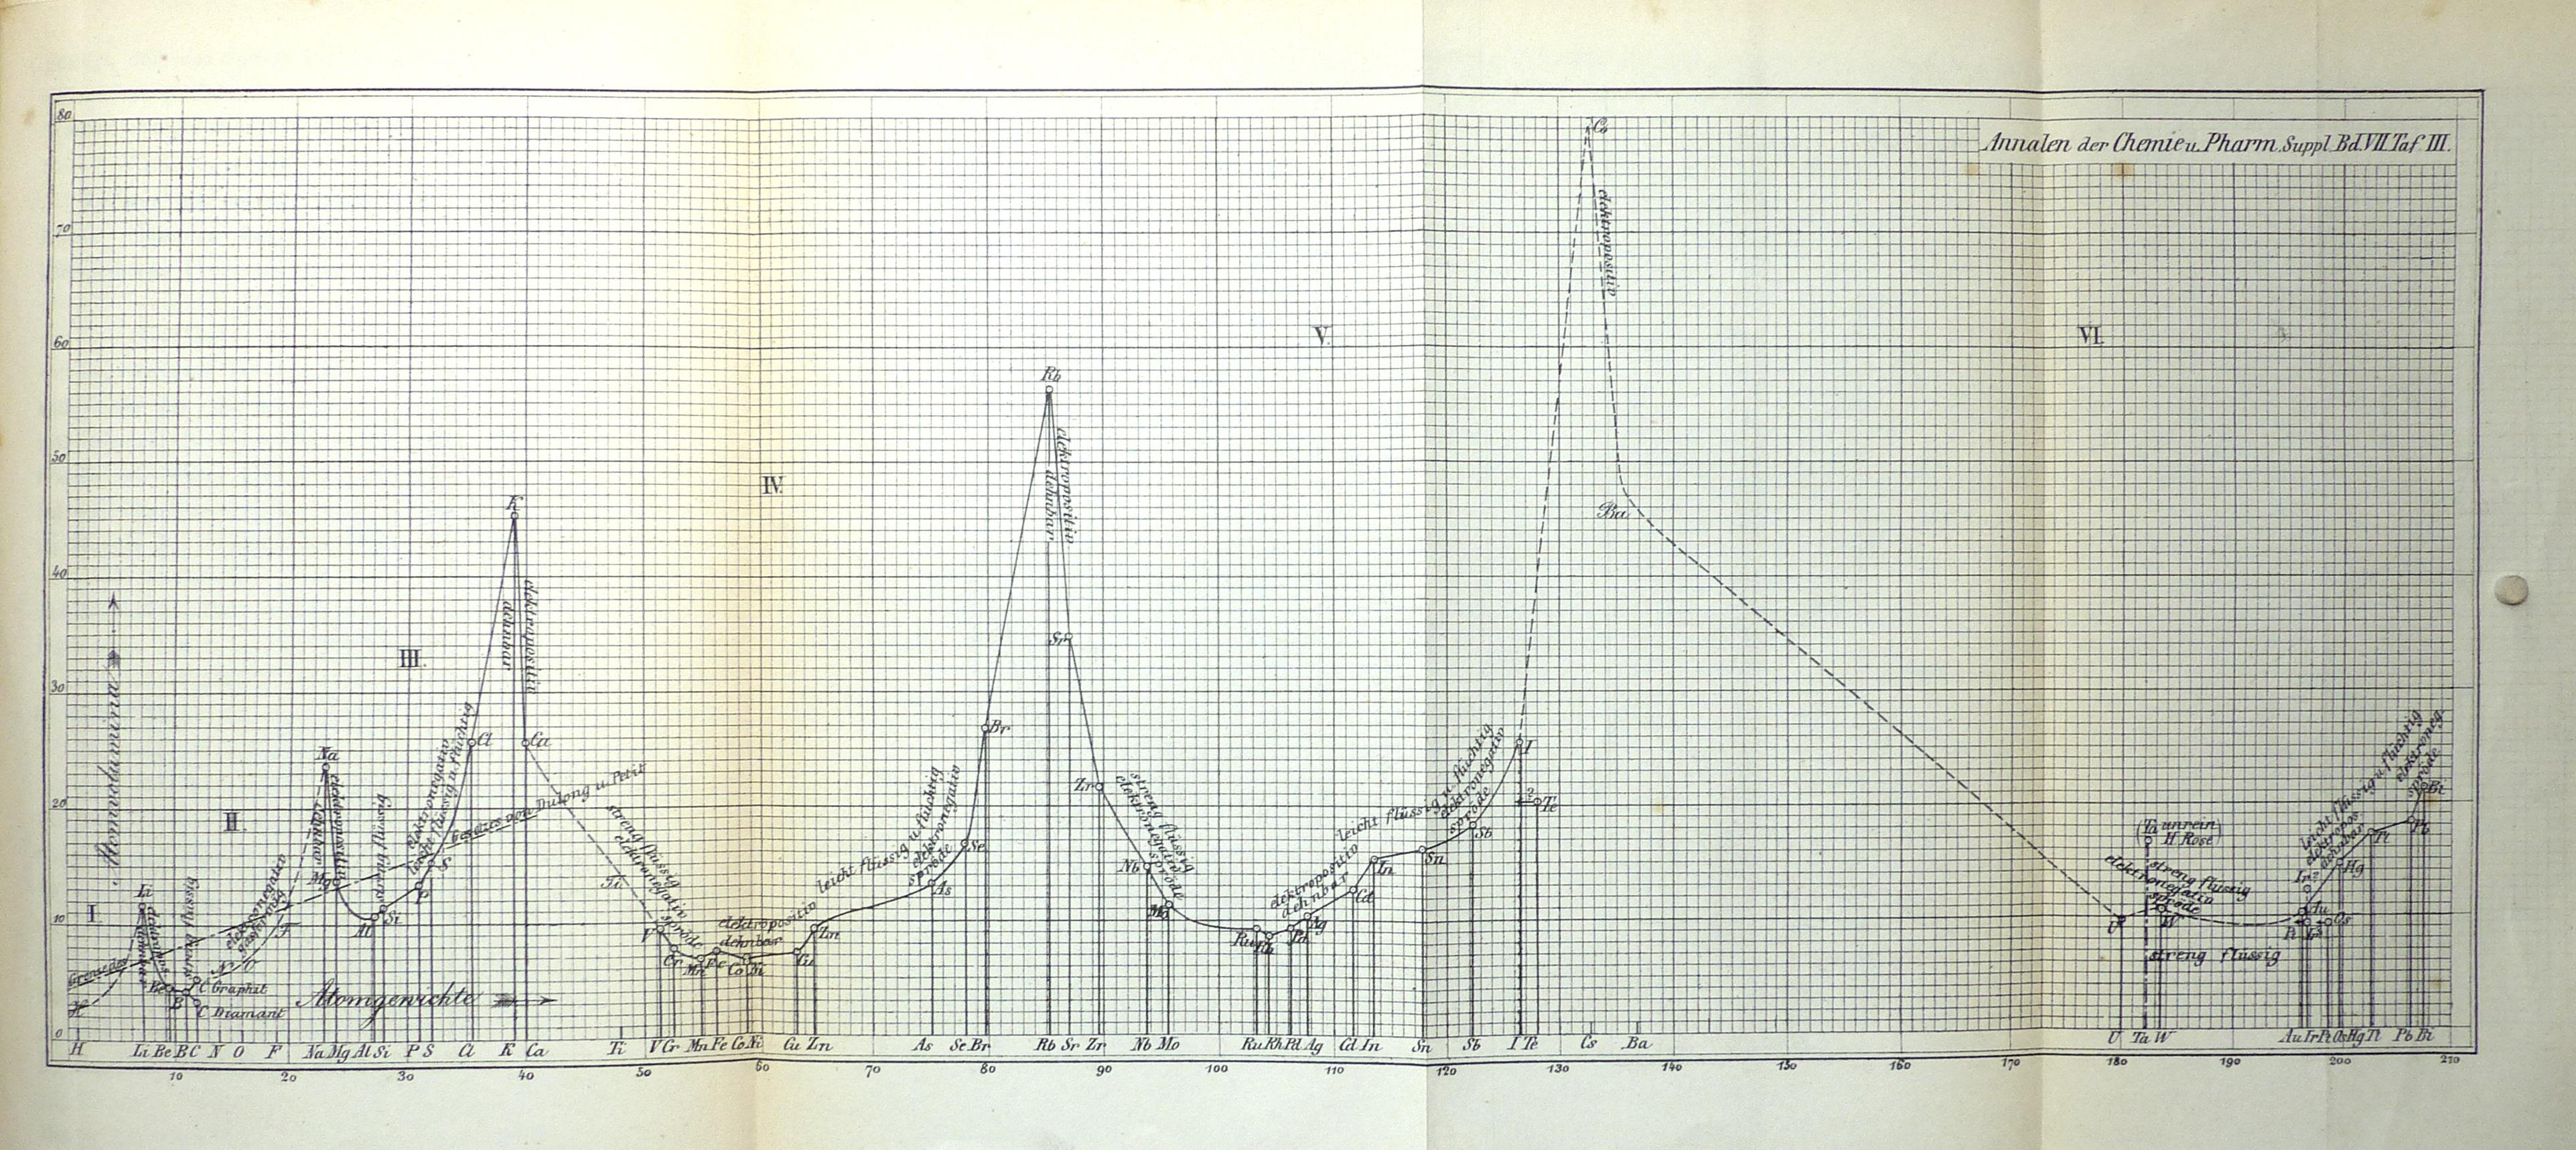
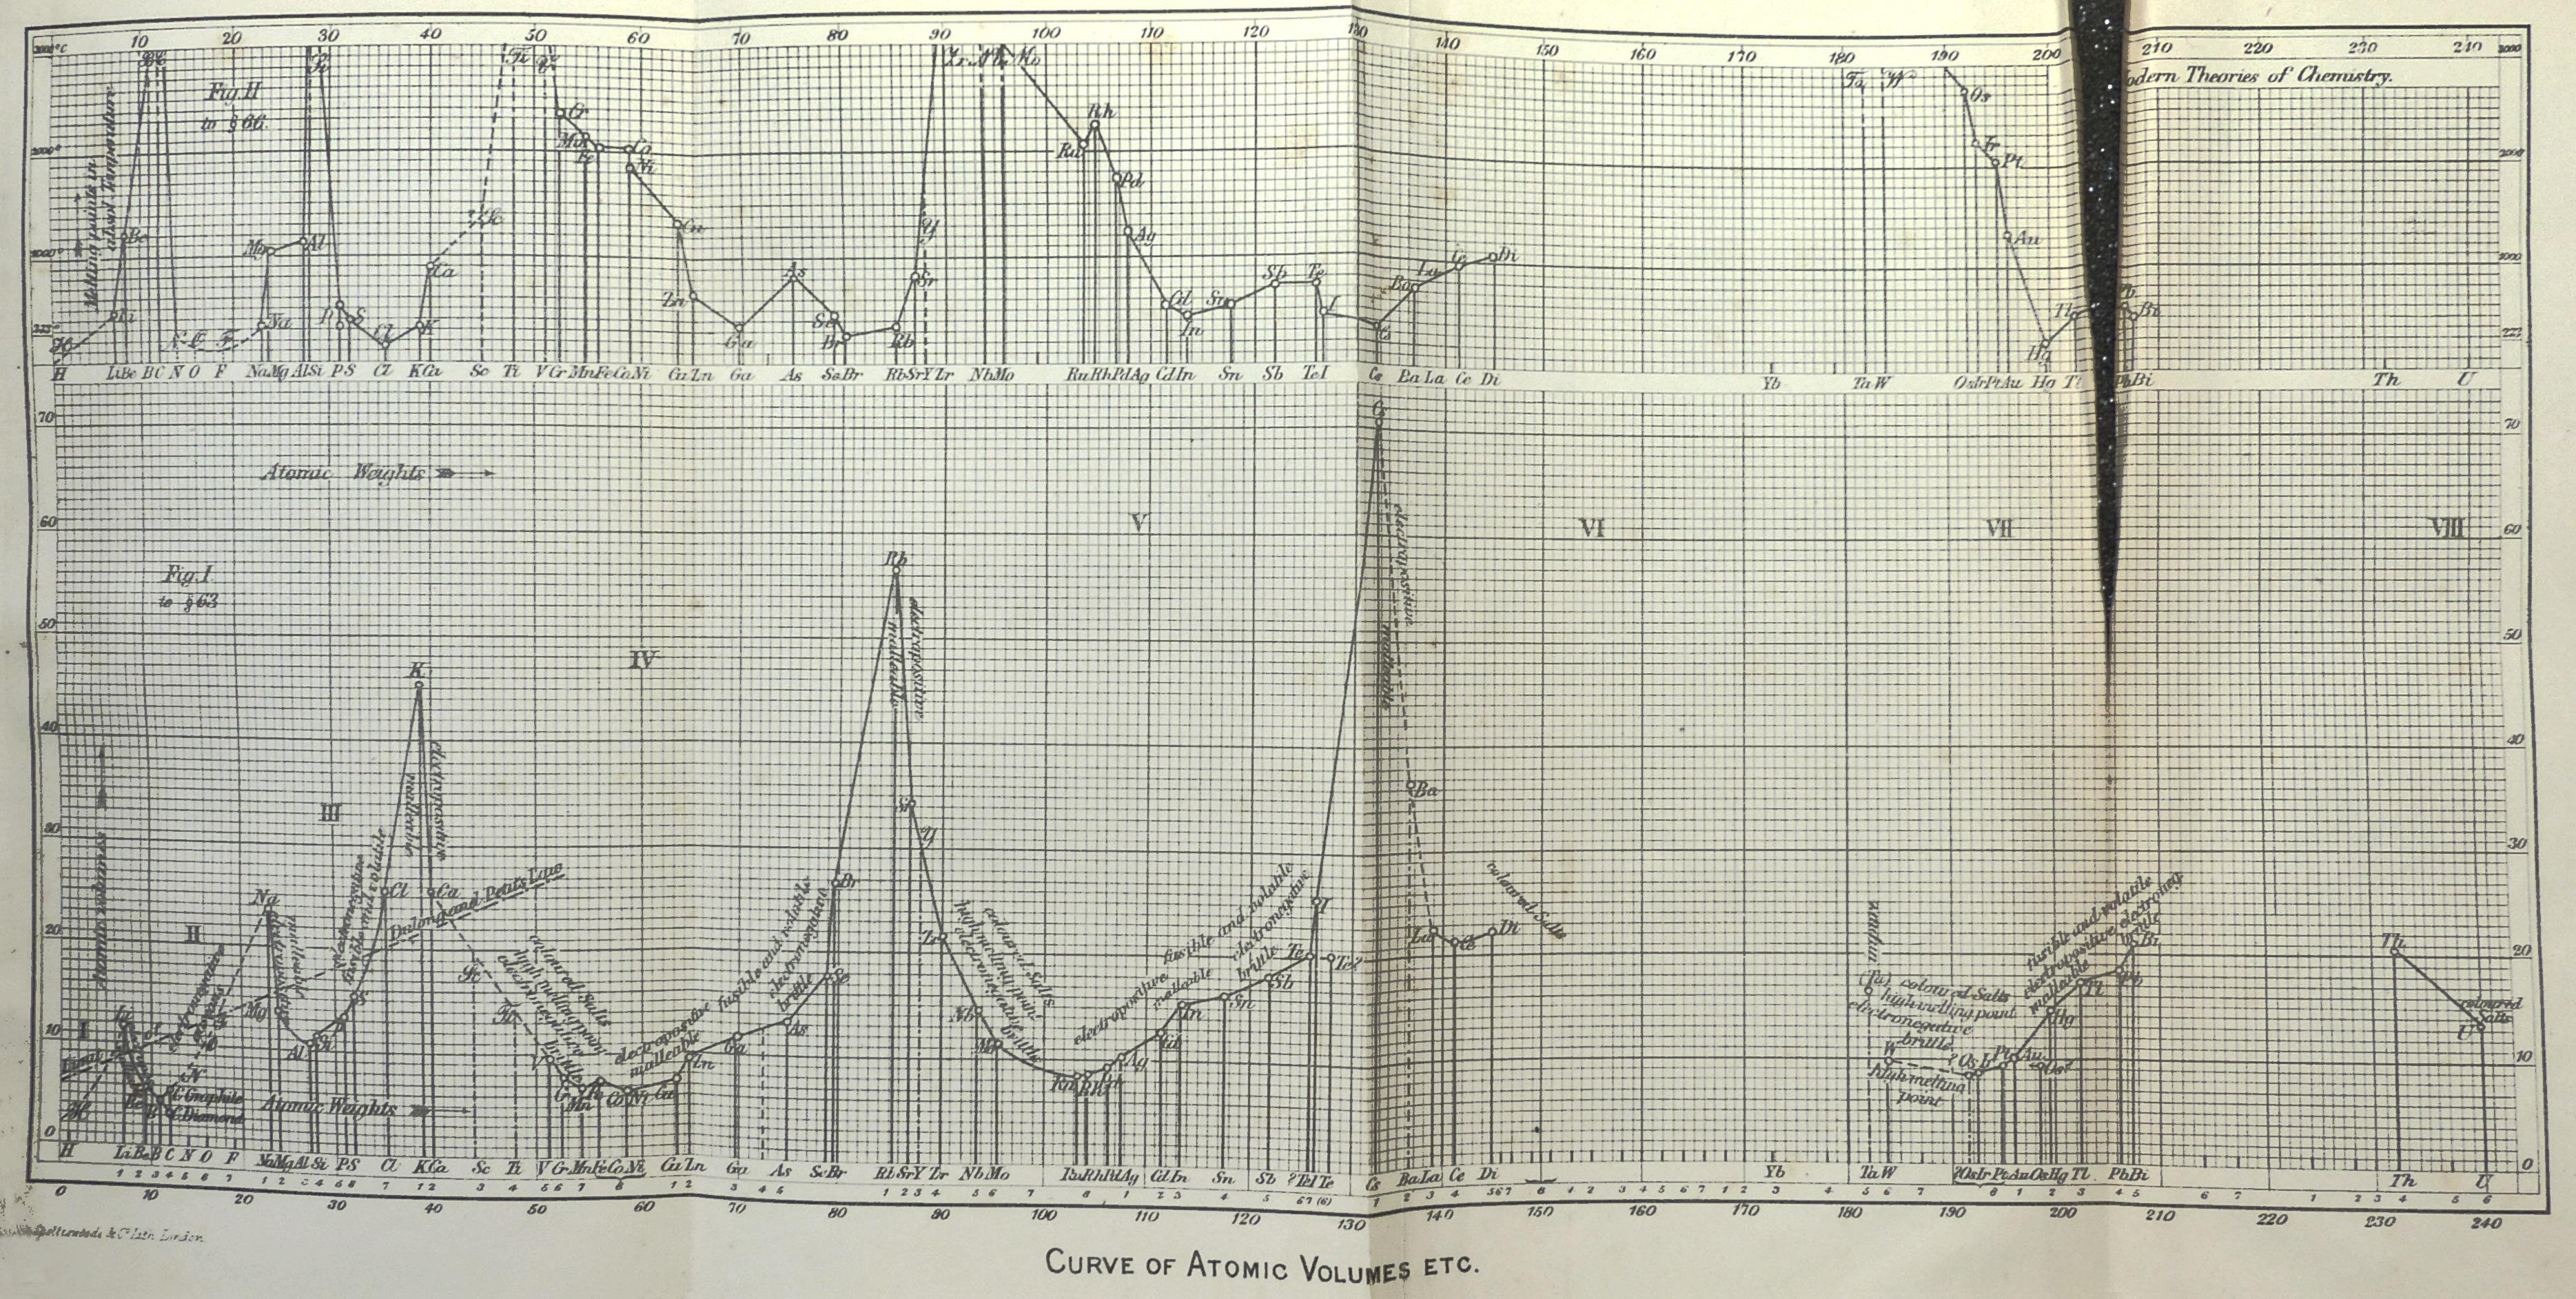
While Meyer published several tabular representations of periodicity, his most well-known system is a graph showing the relationship between atomic weight and atomic volume (1870).1 Meyer’s attention to the quality of data is visible from the graph. For example, to reflect the distinction between well-established and more dubious data, the curve switches from a continuous line to a broken one. In Meyer’s words: “Where the knowledge of the atomic volume of one or more elements is lacking, the curve is drawn in dotted lines.” Note that if we compare the graph above (1870) with the one below (1888)2, it is noticeable that the line becomes dotted not after iodine (I) and tellurium (Te), but after caesium (Cs). This reflects how the information on the properties of the elements became better established. The curve was originally published in Liebig’s Annalen, and Meyer included it in the subsequent editions of his textbook.
Using different kinds of lines of different types of data was a technique used by Neumann’s other students at Königsberg.For example, in his 1856 investigation to optical intensities, Heinrich Wild signified the uncertainty of some results and the precision of others by drawing the less-precise results with a dotted line.3
Meyer's graph was not just a pretty picture - it could also be used for identifying errors in experimental results. If some empirically determined atomic volume did not fall "within the regular course of the curve," then there were good reasons to suspect that it was not accurately determined.
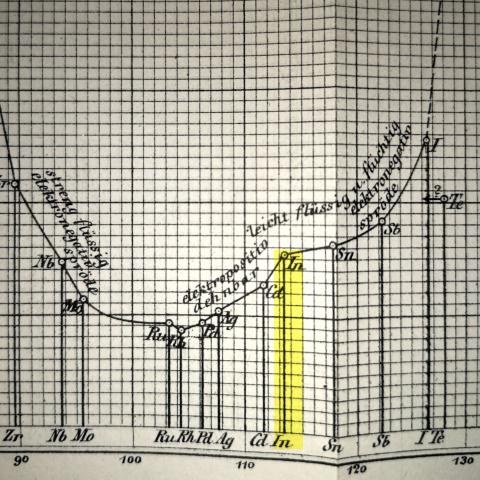
Indium gives a good example of such application of the curve. The curve hinted that its atomic weight should be changed from 37,8 to 113,4. However, Meyer warned that “[i]t would be premature, on such uncertain grounds, to make a change in previously adopted atomic weights.” At most, the curve could only direct “our attention to dubious and uncertain assumptions and urge to re-examine them.” This was an argument about the relationship between theory and experiment. The curve was a theoretical arrangement, and could not be used for tinkering with empirical results. Instead, it could be used to suggest which atomic weights and volumes needed further empirical study.
Meyer argued that it was inappropriate to use the systems to describe the properties of completely unknown elements. However, in 1871, Mendeleev used his system precisely in such way, as he described the properties of three unknown elements he titled eka-aluminium, ekaboron, and ekasilicon.4 Even after the discovery of scandium (ekaboron) and gallium (eka-aluminium), Meyer contended that such use of periodic systems was too risky. Doing so could undermine the reliability of theories in chemistry.
1: Meyer, L. (1870). Die Natur der chemischen Elemente als Function ihrer Atomgewichte. In F. Wöhler, J. Liebig, & H. Kopp (Eds.), Annalen der Chemie und Pharmacie, VII. Supplementband. (pp. 354–363). Leipzig und Heidelberg
2: Meyer, Bedson, Williams, & Bedson, Peter Phillips. (1888). Modern theories of chemistry. London: Longmans, Green, and Co.
3: Olesko, K. M. (1991). Physics as a Calling: Discipline and Practice in the Köningsberg Seminar for Physics. Ithaca and London: Cornell University Press.
4: Mendeleev, D. I. (1871). Periodicheskaya Zakonnost’ Khimicheskikh Ėlementov. In B. M. Kedrov (Ed.), Periodicheskiĭ zakon. Klassiki nauki (pp. 102–176). (1958.) Moscow: Izdatel’stvo akademii nauk SSSR.